- Additive manufacturing
- Advanced membranes
- American Physical Society
- ASC
- Astrophysics
- Atmospheric, Earth, and Energy
- Batteries
- Battery materials
- Bay Area Science Festival
- Biofuels sfa
- Biological Accelerator Mass Spectrometry
- Biosciences and Biotechnology
- Biosecurity
- Biosecurity & Bioscience
- Biosecurity and Bioforensics Group
- Biosecurity sfa
- Capacitive deionization
- Carbon nanotubes
- Carbonate materials
- Center for Accelerator Mass Spectrometry
- Center for Applied Scientific Computing
- Center for High Energy Density Science
- Charity
- Climate change
- Climate science
- Community
- Community gift program
- Computing & Simulation
- Counterterrorism
- COVID-19
- Ct vaccine center
- DARPA
- Data Science
- Data Science Institute
- Defense and Deterrence
- Discovery Center
- Diversity
- DOE
- Education
- Emergency
- Energetic Materials Center
- Energy flow charts
- EOS and Materials Theory Group
- Expanding Your Horizons
- Forensic Science Center
- Fun with science
- Fundamental Science
- Fusion
- Gemini Planet Imager
- Glenn T. Seaborg Institute
- HEAF
- High Energy Density Science
- HOME Campaign
- HPC
- HPC Innovation Center
- HPC4Mfg
- Hydrogen production
- Hydrogen storage
- IEEE
- Inertial confinement fusion
- Intelligence
- Internships
- Jupiter Laser Facility
- Laboratory for Energy Applications for the Future
- Laser Materials
- Lasers
- Lasers and Optical Science Technology
- Livermore Computing
- Livermore Valley Open Campus
- Livermorium
- LLMDA
- LLNS
- Machine learning
- Materials Science
- Microbiology and Immunology Group
- Nanocrystal solar cells
- Nanoscience
- NanoSIMS
- National Ignition Facility
- Neural devices
- Neutrinos
- Newsline
- nEXO
- NNSA
- Nonproliferation
- npneq
- Nuclear
- Nuclear and Chemical Sciences
- Nuclear and Particle Physics Group
- Nuclear Chemical and Isotopic Science
- Nuclear forensics
- NuSTAR
- Office of Science
- Outreach
- Oxidation and degradation
- pcmdi
- People
- Periodic table
- Physics
- Planetary Defense
- Postdocs
- Procurement
- Quantum Simulations Group
- Rare-earth elements
- Rubin Observatory
- Science
- Science and Technology Review
- Science on Saturday
- Sequestration
- Soil microbiome sfa
- Solar
- Solar system
- Solid-state batteries
- Space
- Space Science Institute
- STEM
- Stockpile stewardship
- Students
- Summer Student Spotlight
- Supercapacitors
- Supercomputer
- Supercomputing
- Surface analysis
- Sustainability
- Technology Transfer
- Tours
- Transport system
- Traumatic brain injury
- User Facility
- Veterans
- Viruses
- Water
- Water research
- Weapons
- Women in STEM
- Women's Hall of Fame
- WWW Research Landing Page
- X-ray
Back
Energy flow charts
Americans used less energy in 2015
Americans used less energy overall in 2015 than the previous year, according to the most recent energy flow charts released by Lawrence Livermore National Laboratory.Each year, the Laboratory releases energy flow charts that illustrate the nation's consumption and use of energy. Overall, Americans used 0.8 quadrillion BTU, or quads, less in 2015 than in 2014 (a BTU or…
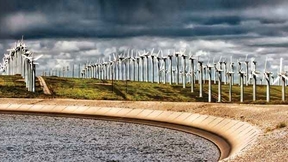
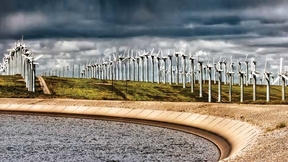
American energy use up slightly, carbon emissions almost unchanged
Americans' energy use continued to grow slowly in 2014, fueled by increases in the use of natural gas, wind and solar, according to the most recent energy flow charts released by Lawrence Livermore National Laboratory.Each year, the Laboratory releases charts that illustrate the nation's consumption and use of energy. Overall, Americans used 0.9 quadrillion (quads) British…
Americans using more energy according to Lawrence Livermore analysis
Americans used more renewable, fossil and even nuclear energy in 2013, according to the most recent energy flow charts released by Lawrence Livermore National Laboratory.Each year, the Laboratory releases energy flow charts that illustrate the nation's consumption and use of energy. Overall, Americans used 2.3 quadrillion thermal units more in 2013 than the previous year…
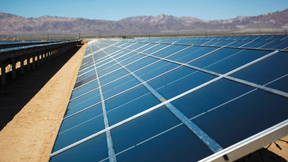
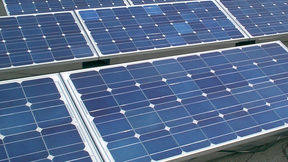
Americans continue to use more renewable energy sources
Americans used more natural gas, solar panels and wind turbines and less coal to generate electricity in 2012, according to the most recent U.S. energy charts released by Lawrence Livermore National Laboratory . Each year, the Laboratory releases energy flow charts that track the nation's consumption of energy resources. Natural gas use is up particularly in the…