Americans used less energy in 2015
 (Download Image)
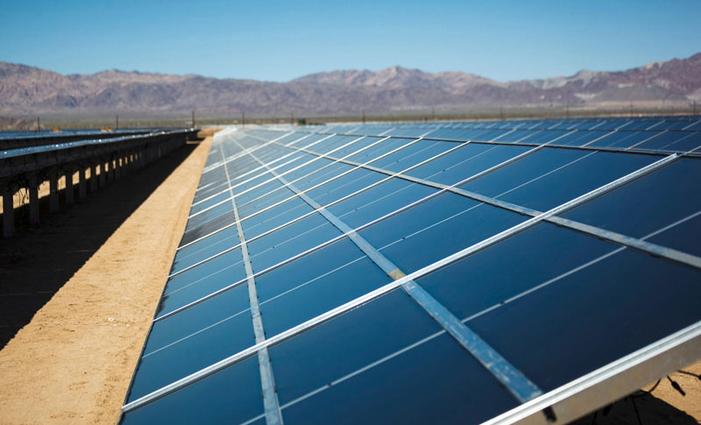
Americans used less energy overall in 2015 than the previous year, according to the most recent energy flow charts released by Lawrence Livermore National Laboratory.
(Download Image)
Americans used less energy overall in 2015 than the previous year, according to the most recent energy flow charts released by Lawrence Livermore National Laboratory.
Americans used less energy overall in 2015 than the previous year, according to the most recent energy flow charts released by Lawrence Livermore National Laboratory.
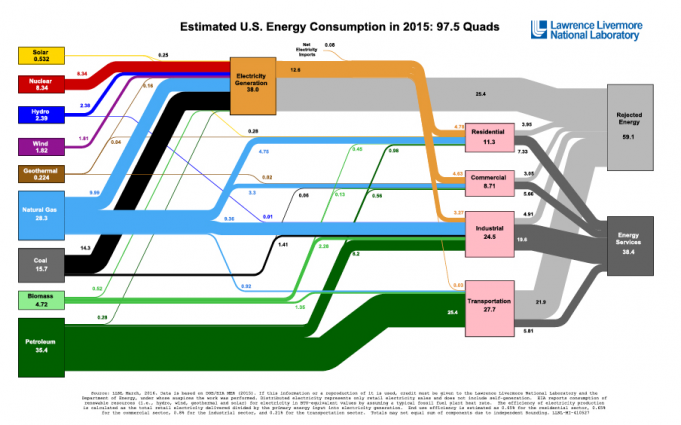
Each year, the Laboratory releases energy flow charts that illustrate the nation's consumption and use of energy. Overall, Americans used 0.8 quadrillion BTU, or quads, less in 2015 than in 2014 (a BTU or British Thermal Unit, is a unit of measurement for energy; 3,600 BTU is equivalent to about 1 kilowatt-hour).
Natural gas use increased by 3 percent to 28.3 quads while coal use decreased by 12 percent to 15.7 quads. "The drop in coal consumption is almost entirely due to the electricity sector, which continues to use more natural gas, in favor of coal," said A.J. Simon, group leader for LLNL’s energy program. "In fact, much of the overall decrease in energy consumption can be traced to the shift from coal to gas, because modern gas-fired plants may use up to 46 percent less energy to produce the same amount of electricity."
Contact
 Anne M. Stark
[email protected]
(925) 422-9799
Related Links
Energy Flow ChartsAmericans using more energy according to Lawrence Livermore analysis
Tags
Earth and Atmospheric ScienceEnergy flow charts
Physical and Life Sciences
Energy
Featured Articles