National economy continues to reenergize post-pandemic, while pushing toward a new, decarbonized normal
 (Download Image)
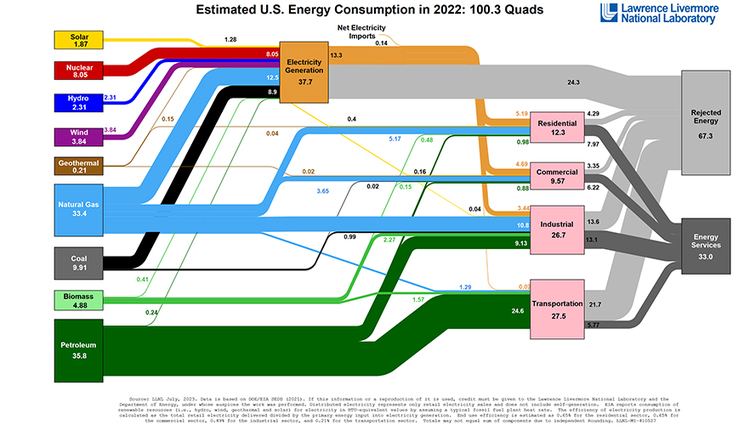
Americans used more renewables to generate electricity than in previous years, according to the most recent energy and carbon flow charts produced by Lawrence Livermore National Laboratory.
In 2022, Americans used more renewables to generate electricity than in previous years, according to the most recent energy flowcharts and carbon flowcharts released by Lawrence Livermore National Laboratory (LLNL).
The nation used 3% more energy, emitted an additional 96 million tons of CO2, but decreased the carbon intensity of U.S. electricity generation by 3.6%, compared to 2021.
Each year, LLNL releases flowcharts that illustrate the nation's consumption and use of energy, as well as CO2 emissions. In 2020, annual consumption and carbon intensity of U.S. energy plummeted due to the COVID-19 pandemic but since then, energy consumption has continued to increase back to pre-pandemic levels across all sectors.
U.S. energy consumption (100.3 quads*) in 2022 surpassed 2019’s pre-pandemic energy consumption of 100.2 quads, but is still less than 2018 heights of 101.2 quads (a single quad is as much energy as 20 million passenger cars use per year).
The carbon intensity of U.S. energy in 2022, in contrast, has not rebounded to pre-pandemic values; it has decreased from 51.2 to 49.4 million tons of CO2/quad, comparing 2019 and 2022. This decrease in carbon intensity was driven by decarbonization trends in electricity generation specifically, whose carbon intensity fell from 42 to 40.5 million tons CO2/quad between 2021 and 2022 (compared to 43.7 million tons CO2/quad in 2019).
“This change is not just a result of the pandemic,” said Hannah Goldstein, principal investigator for LLNL’s energy flowcharts, “instead, this is result of the efforts that the U.S. is undertaking to deliver energy at scale with non-fossil sources.”
Comparing 2021 and 2022, non-fossil energy sources represented the largest increases, by percentage, with a 25% (0.37 quads) increase in solar and 15% (0.51 quads) increase in wind energy production. These increases were greater than in 2021, representing an acceleration of the solar and wind energy sectors.
The greatest energy source increase, by magnitude, was natural gas, which increased by 2.1 quads (6.7%), representing the highest annual use of natural gas on record, according to the U.S. Energy Information Administration (EIA). Other energy sources increased modestly between 2021 and 2022, including geothermal, petroleum, hydropower and biomass, which increased by 5% (0.01 quads), 2% (0.7 quads), 1.3% (0.03 quads), and 1% (0.05 quads), respectively.

The only two energy sources that decreased their production were nuclear and coal. Nationally, nuclear energy only decreased modestly (-1%), but had major state impacts through specific power plant closures.
The largest decrease in a single energy source was coal, with a 5.6% (0.59 quads) decrease. According to the U.S. Energy Information Administration, 2022 was the second-lowest year for coal-produced energy in the past 60 years. The greatest coal energy decreases between 2020 and 2021 were observed in Oregon and Washington, with 38% (22.5 trillion BTU) and 93% (16.5 trillion BTU) decreases, respectively.
Alongside the national flowcharts, LLNL also has released energy and carbon flowcharts for 2020 and 2021 for all 50 U.S. states.
These flowcharts illustrate each state’s energy evolution since the COVID-19 pandemic, energy demand and the different energy sources they have developed and relied upon to meet post-pandemic energy needs.
“Changes that we observed in each state’s energy and carbon flows represent a combination of local energy resources, state priorities and ability to reliably meet swiftly increasing post-pandemic energy demands,” said Kimberley Mayfield, co-principal investigator for LLNL’s energy flowcharts. “The three ubiquitous observations across nearly all 50 states were increases in petroleum-powered transportation and solar energy, as well decreases in hydropower energy production.”
Notable observations from the flowcharts are visualized in the map above, but can be analyzed in greater detail by accessing LLNL’s U.S. state flowcharts directly online.
“From the data, we observed that the majority of states, 37, saw a net increase in non-fossil energy sector sources,” said Ziad Ammar, LLNL engineer for the energy flowcharts. “Mississippi, Wyoming and New Mexico were the top three states leading the nation, by percentage, in non-fossil energy increases (43%, 35% and 31%, respectively), predominantly from nuclear and wind energy increases.”
* A quad is a unit of measurement for energy equal to 1015 British Thermal Units (BTU). One BTU is the amount of heat it takes to raise 1 pound (~ 1 pint) of water by 1 degree Fahrenheit. Approximately 3,412 BTUs is equivalent to 1 kilowatt-hour, which is the amount of energy it takes to light an efficient LED lightbulb for a week.
Contact
 Anne M. Stark
[email protected]
(925) 422-9799
Related Links
Energy FlowchartsCarbon Flowcharts
U.S. Energy Information Administration
U.S. State Flowcharts
Tags
Earth and Atmospheric ScienceAtmospheric, Earth, and Energy
Physical and Life Sciences
Science
Featured Articles