LAB REPORT
Science and Technology Making Headlines
Aug. 28, 2020
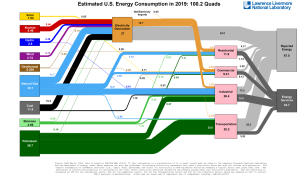
LLNL releases energy flowcharts every year that compare energy sources and the end users.
Going with the flow
Every year, Lawrence Livermore National Laboratory releases flowcharts illustrating U.S. energy consumption and use. The flowcharts, called Sankey diagrams, allow scientists, analysts and other decision-makers to compare the contributions made by various energy sources, including nuclear power, and the end uses of those sources, including residential, industrial, commercial and transportation markets. Taken as a series of annual snapshots, energy use trends and opportunities quickly become apparent.
This year, in addition to releasing the 2019 energy flowchart, the Lab issued state-by-state energy flowcharts for 2015–2018 and carbon emissions charts for 2014–2017. The Lab is working on charts of international energy use that it hopes to release by the end of the year.
What’s a Sankey diagram? The flowcharts pack a lot of quantitative data into a single-page graphic. Read from left to right, they contain information about resource, commodity and byproduct flows, and interwoven resource streams help clarify the nation’s complex system of energy use.

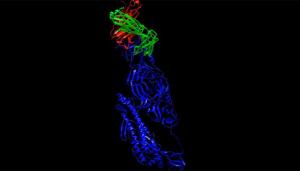
This visualization depicts the 3D structure of an antibody candidate binding to the protein of SARS-CoV-2, the virus that causes COVID-19.
A computational look at COVID-19 antibodies
Computation and experimentation are yielding possible therapeutic compounds for COVID-19.
At Lawrence Livermore, Jim Brase leads the computational effort on the coronavirus. He says the Lab’s considerable unclassified computing assets have been running physics-based models to probe the molecular dynamics between proteins and compounds in a search for drug candidates and antibodies that will counter the coronavirus. Antibodies are proteins that bind to and neutralize alien proteins.
“You have two very complex molecules and you are trying to see how they come together and what the energy of their binding strength is,” Brase said. “These are typically million-atom calculations, and you have to let [the atoms] jiggle around and settle into their lowest energy states.” The process must be repeated hundreds of times to obtain the average binding energy. “Then you move to the next potential configuration. If you have a thousand of those, you are doing a lot of calculations.”
A commercial vendor manufactures the computer-designed antibodies for Livermore and Sandia national laboratories, where researchers assay them to determine if they bind to their SARS-CoV-2 targets. Artificial intelligence (AI) is used in sorting the field of potential new molecules from the nearly infinite number of possible combinations of amino acids.

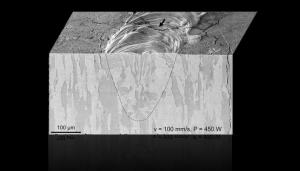
By combining simulations with high-speed videos taken during the laser powder-bed fusion process, LLNL scientists were able to visualize the ductile-to-brittle transition in 3D-printed tungsten in real-time, allowing them to observe how microcracks initiated and spread in the metal.
Cracking up
Boasting the highest melting and boiling points of all known elements, tungsten has become a popular choice for applications involving extreme temperatures, including lightbulb filaments, arc welding, radiation shielding and, more recently, as plasma-facing material in fusion reactors such as the ITER Tokamak.
However, tungsten’s inherent brittleness, and the microcracking that occurs while additively manufacturing (3D printing) with the rare metal, has hampered its widespread adoption.
To characterize how and why these microcracks form, Lawrence Livermore scientists have combined thermomechanical simulations with high-speed videos taken during the laser powder-bed fusion metal 3D printing process. Whereas previous research was limited to examining cracks post-build, scientists for the first time were able to visualize the ductile-to-brittle transition (DBT) in tungsten in real-time, allowing them to observe how microcracks initiated and spread as the metal heated and cooled. The team was able to correlate the microcracking phenomenon with variables such as residual stress, strain rate and temperature, and confirm the DBT caused the cracking.


Simulated strength of shaking from a magnitude 7.0 Hayward Fault earthquake showing peak ground velocity (color bar) and seismograms (blue) at selected locations (triangles).
Shake, rattle and roll
A Lawrence Livermore National Laboratory team has published new supercomputer simulations of a magnitude 7.0 earthquake on the Hayward Fault. This work represents the highest-ever resolution ground motion simulations from such an event on this scale.
Simulations resolved rapidly varying shaking with broader band frequencies up to 10 Hz, doubling resolution of previous runs. Seismic waves as short as 50 meters were resolved across a regional-scale domain covering the San Francisco Bay Area from Napa to San Jose and the Sacramento-San Joaquin Delta to the Pacific Ocean.
Previous simulations lacked the performance and memory to model such high-frequency motions on such a large domain. High-frequency shaking is critical for evaluating seismic hazards and the risk of damage to the built environment, such as buildings, homes, transportation and utility lifelines.

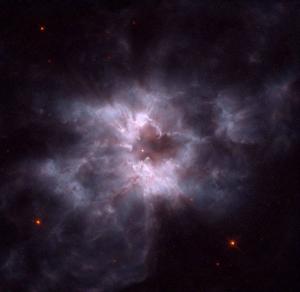
A white dwarf star begins its life by casting off the cocoon that enclosed it. In the structure, the planetary nebula designated NGC 2440, contains one of the hottest white dwarfs known. The white dwarf is the bright dot near the photo's center. Photo courtesy of NASA/R. Ciardullo (PSU)/H. Bond (STScI).
Under pressure
Much of the matter in the universe — the interiors of planets, stars and dense stellar remnants such as white dwarfs — exists in forms unlike anything encountered on Earth’s surface. At pressures above 1 Mbar (a million times the pressure of Earth’s atmosphere), chemical bonds start to be ripped apart.
Above 100 Mbar, even the core electrons in elements such as carbon are torn away from their nuclei.
Those changes naturally influence material properties, including how much a material compresses in response to additional pressure. And those properties manifest in observable behavior, such as the brightness variations in pulsating white dwarfs. To accurately model the pulsations and other aspects of stellar evolution, researchers need to understand how matter behaves under extreme pressure.
Researchers at Lawrence Livermore's National Ignition Facility (NIF) increased pressure from previous laboratory measurements (at 60 Mbar) by nearly an order of magnitude. Designed for researching nuclear fusion, NIF uses lasers to deliver hundreds of kilojoules of energy to a centimeter-long cavity containing a sample. Key to the high pressures in the new work was launching the shock wave in a spherically convergent geometry.
Even at the high end of that range, the experiment is far from simulating the interior of a white dwarf. But the pressures are typical of those found in a white dwarf’s convective outer envelope, the region most responsible for the pulsation modes. With new experimental constraints on the envelope’s compressibility, astronomers will be able to better model how pulsating white dwarfs form and behave.


