Back
 (Download Image)
Ocean salinity trends show human fingerprint
(Download Image)
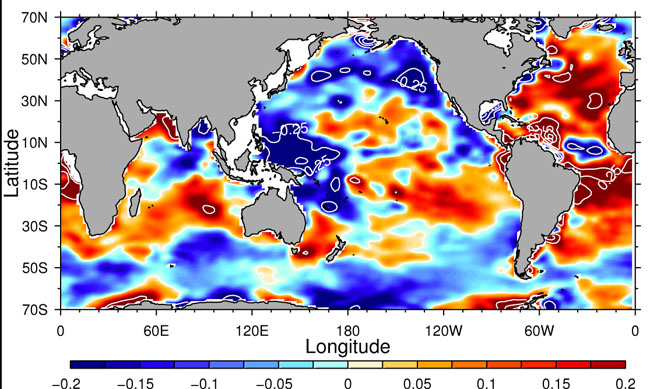
Surface salinity changes for 1950 to 2000, units express absolute salinity changes for the 50-year period (PSS-78). Red indicates regions becoming saltier, and blue regions becoming fresher. For more information on observed surface salinity changes, see the previous publication : (Durack et al. 2012 ) . Image by Paul Durack/CSIRO
Changes in ocean salinity over the second half of the 20th century are consistent with changes driven by human activities and are inconsistent with natural climate variations, according to a new study by Laboratory researchers.
Observed salinity changes agree with what computer models have suggested would happen to salinity patterns in a warming world, said Scripps climate researcher David Pierce, the study's lead author of an article appearing in Geophysical Research Letters and a scientist from Scripps Institution of Oceanography, UC San Diego. Ocean salinity changes are driven by the world's patterns of evaporation and rainfall, which themselves are changing.
Salinity observations over the second half of the 20th century have found a general intensification of existing patterns. These suggest that salty ocean regions have experienced even more evaporation, becoming saltier, and relatively fresh regions have becoming even more diluted with precipitation. The patterns express global changes in precipitation and evaporation, which comprise the global water cycle, and this cycle and changes to it are expected to extend over land regions as well.
Pierce said the significance of the study is that it provides an independent check of the effects of climate change on the global water cycle using completely different instruments and techniques than long-term land-based weather station rainfall measurements. Studies of rainfall changes over land are harder to place in context of climate change because of the episodic nature of storms, which bring rainfall to land areas, and changes to the observing network over the years.
"Salinity in the ocean averages out all that variability," Pierce said.
Co-authors include Peter Gleckler, Benjamin Santer and Paul Durack of the Lawrence Livermore National Laboratory and Tim Barnett of Scripps Oceanography.
The study builds on previous analyses conducted in the last decade by Barnett, Pierce, and others that demonstrated that rising temperatures in the upper 700 meters (2,000 feet) of the ocean also can only be explained by anthropogenic climate change. The observed global warming is caused mostly by an accumulation of carbon dioxide created by fossil fuel use.
The previous temperature studies and this analysis of ocean salinity and temperature use a technique known as detection and attribution. Using this method, observed changes in ocean salinity and temperature are compared to the effects of various historical phenomena such as volcanic eruptions or solar fluctuations and to climate cycles such as El Ni?o. When the computer climate models were run, the influence of those phenomena does not replicate the salinity or temperature patterns that researchers have observed since 1955. Only when the addition of carbon dioxide (and other greenhouse gases) associated with human activity were added could the observed salinity and temperature changes be explained by the models, according to Durack.
The paper appears in the Nov. 2 edition of the journal, Geophysical Research Letters .
The work was funded through the Laboratory, Scripps Institution of Oceanography and the National Oceanic and Atmospheric Administration.
Nov. 2, 2012
[email protected]
925-422-9799


Contact
Anne M Stark[email protected]
925-422-9799
Tags
Physical and Life SciencesFeatured Articles