Lawrence Livermore issues state-by-state combined energy and water use flow charts
 (Download Image)
There are several major interactions between energy and water supplies, infrastructures and disposition across the economy. The major uses of water in energy applications include: cooling of thermal power plants; hydropower; oil and natural gas extraction; coal production; biomass production; and fuel refining.
(Download Image)
There are several major interactions between energy and water supplies, infrastructures and disposition across the economy. The major uses of water in energy applications include: cooling of thermal power plants; hydropower; oil and natural gas extraction; coal production; biomass production; and fuel refining.
For the first time, Lawrence Livermore National Laboratory (LLNL) has issued state-by-state energy and water flow charts in one location so that analysts and policymakers can find all the information they need in one place.
LLNL worked with the U.S. Department of Energy (DOE) and the National Energy Technology Laboratory (NETL) to produce the atlas of hybrid energy/water Sankey diagrams for each of the states. These diagrams depict energy use and water flow during the year 2010, the latest year for which comprehensive data is available. See the charts.
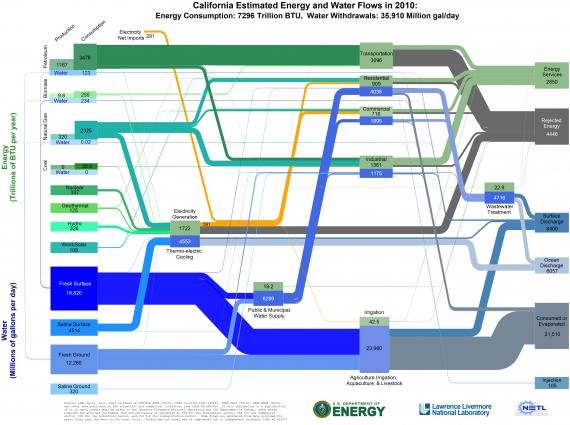
Sankey diagrams can be used to frame important discussions around energy and material resources, use and disposition. These new diagrams provide federal, state and local planners, governmental agencies, educators and nongovernmental organizations with detailed information to support decision-making about public investment in innovation and energy-water policy.
"With changes in the energy sector at the national scale, severe water constraints at the state level and a growing awareness of the interconnectedness of energy and water, there is an appetite for information products that depict energy and water for policymakers," said A.J. Simon, associate program leader for LLNL’s water security and technologies.
Policy intended to advance the security, affordability and sustainability of energy and water can occur at the federal, regional, state and local level. States often are responsible for instituting responsive and impactful energy and water policy. Much of the data necessary to visualize energy and water flows, and thus to inform policymakers, are collected at the state level.
There are several major interactions between energy and water supplies, infrastructures and disposition across the economy. The major uses of water in energy applications include: cooling of thermal power plants; hydropower; oil and natural gas extraction; coal production; biomass production; and fuel refining. The major uses of energy in water management include: water treatment and distribution; wastewater treatment including water recycling; agricultural water supply; and long-distance conveyance.
The analysis includes a combination of diverse sources of background data and builds upon the methodology used by DOE to create a national energy/water diagram. The methodology and assumptions used to create these charts is described in an accompanying report, and the data depicted in the charts is publicly available for download. The diagrams, data and report are a toolbox for technologists, policymakers and educators to explore the structure of energy-water systems at the state level.
Contact
 Anne M. Stark
[email protected]
(925) 422-9799
Related Links
Energy and water use flow chartsHybrid State Energy-Water Nexus 2010 Report
Tags
Physical and Life SciencesFeatured Articles