Interactive Visualization Tool for Drugs and Therapeutic Agents in COVID-19 Open Research Dataset (CORD-19)
We extracted drug compounds and therapeutic agents mentioned in the COVID-19 Open Research Dataset (CORD-19 as of June 22, 2020) using natural language processing and provide this extracted information in an interactive data visualization dashboard for researchers to explore which drug compounds have been used to treat and/or study coronavirus/COVID-19. We have labeled the extracted drugs with their anatomical therapeutic codes (ATC) used by the World Health Organization (WHO) to classify drug compounds, as well as their known efficacies (per the KEGG database) where examples of different efficacy categories include antiviral, antibacterial, anti-inflammatory, pharmaceutical aid, and so on. With this interactive tool, researchers studying treatments for COVID-19 can quickly visualize the drug compounds that have been studied, the combination of drugs that have been explored, and the classes of drugs that are being mentioned in scientific literature. The visualization tool also contains links to the ChEMBL database for each individual compound if detailed information on any specific drug is desired.
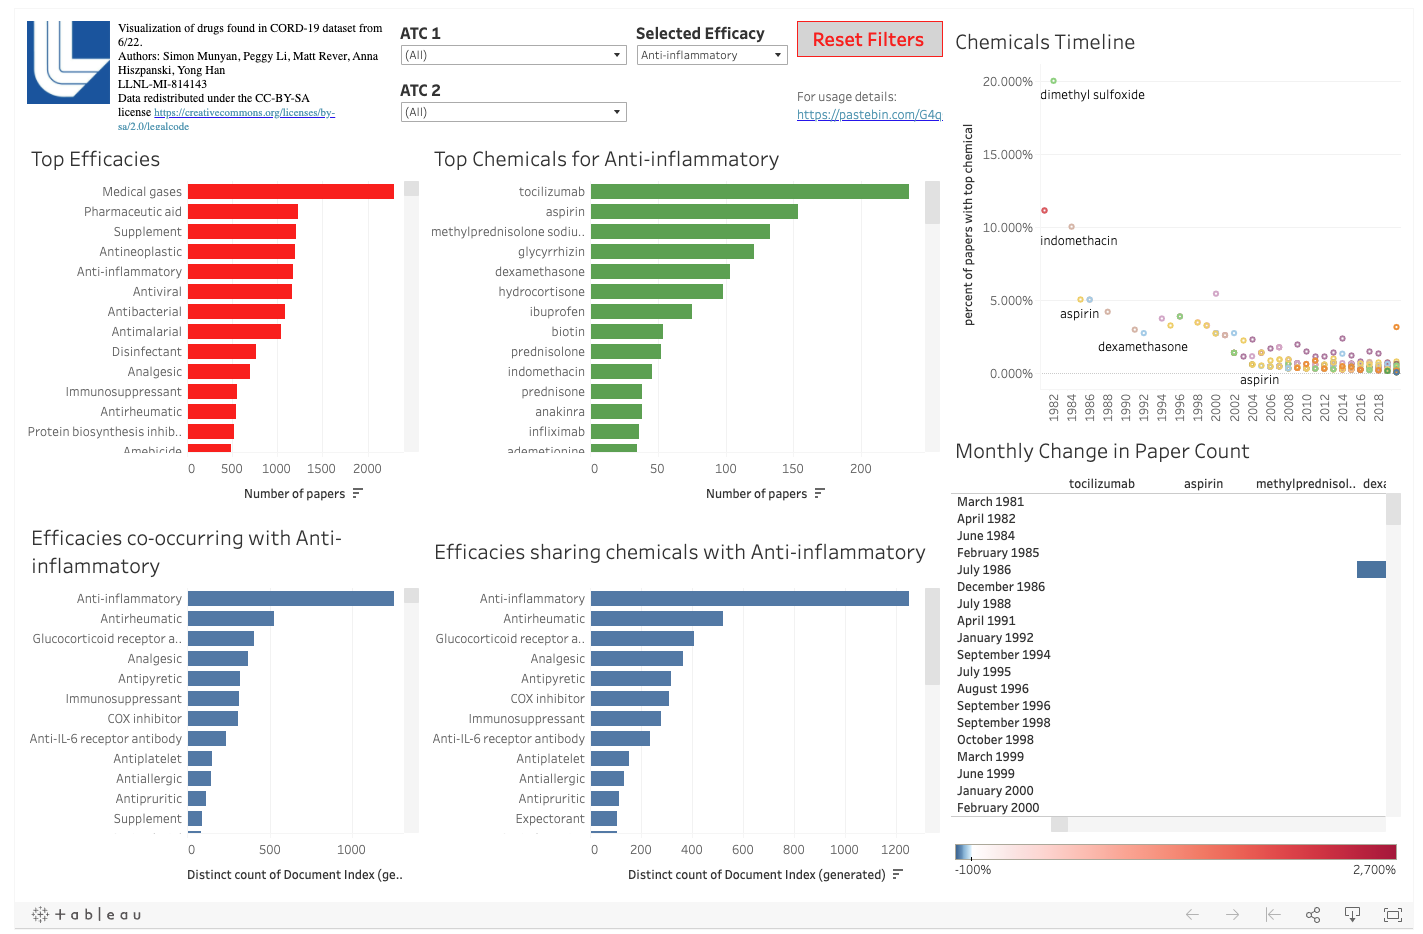
The CORD-19 visualization tool is available on Tableau. The dashboard is composed of six panels that present different views of the data:
- Top Efficacies: Shows most frequently mentioned efficacies of the drugs in CORD-19 data.
- Top Chemicals for X: Shows highest occurring drugs for the elected efficacy in CORD-19 data.
- Efficacies of Drugs Co-Occurring with X: Shows efficacies of the drugs that are mentioned together with selected efficacies or drugs to understand which other types/classes of drugs are being administered or mentioned simultaneously with the selected drugs.
- Efficacies Sharing Chemicals with X: Some drugs have more than one known efficacy (e.g., some antiviral drugs have additional efficacy labels such as HIV protease inhibitor or neuraminidase inhibitor). Shows multiple efficacy labels for the selected drug.
- Chemical Timeline: Shows % of the papers mentioning the selected drug compounds per year (normalized per amounts of papers published in that year).
- Monthly Change in Paper Count: Shows changes in the number of papers mentioning the selected drug compound per month compared to the previous month.
Additional details about the Tableau dashboard's controls, panels, and functions can be found in the project's instructions file.